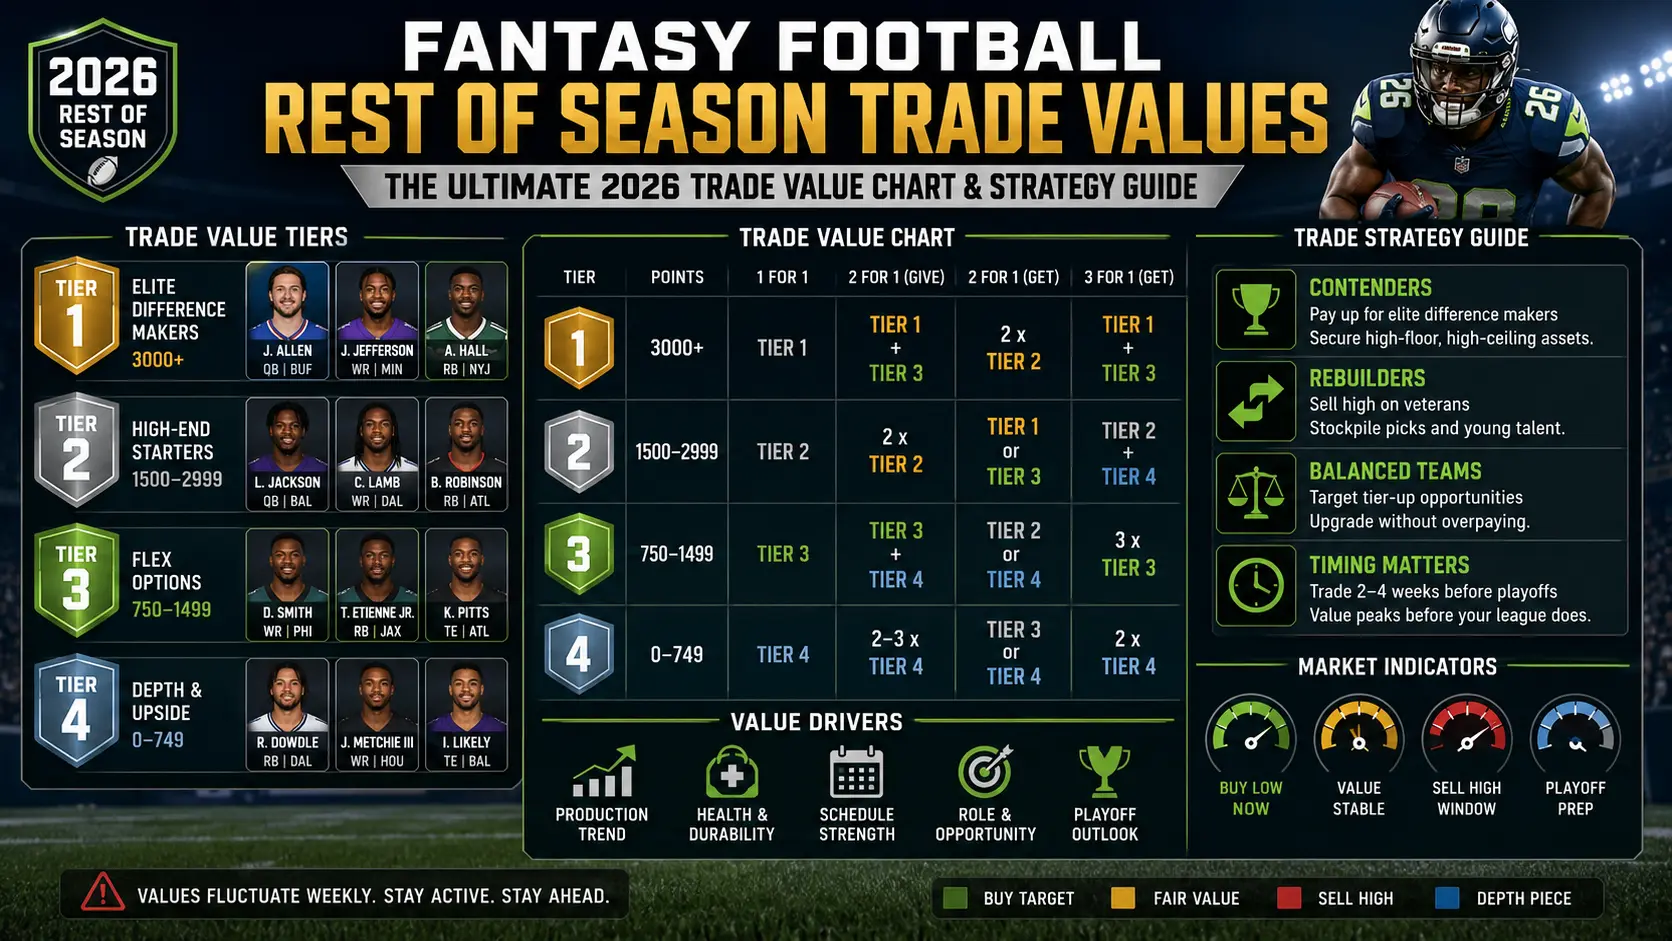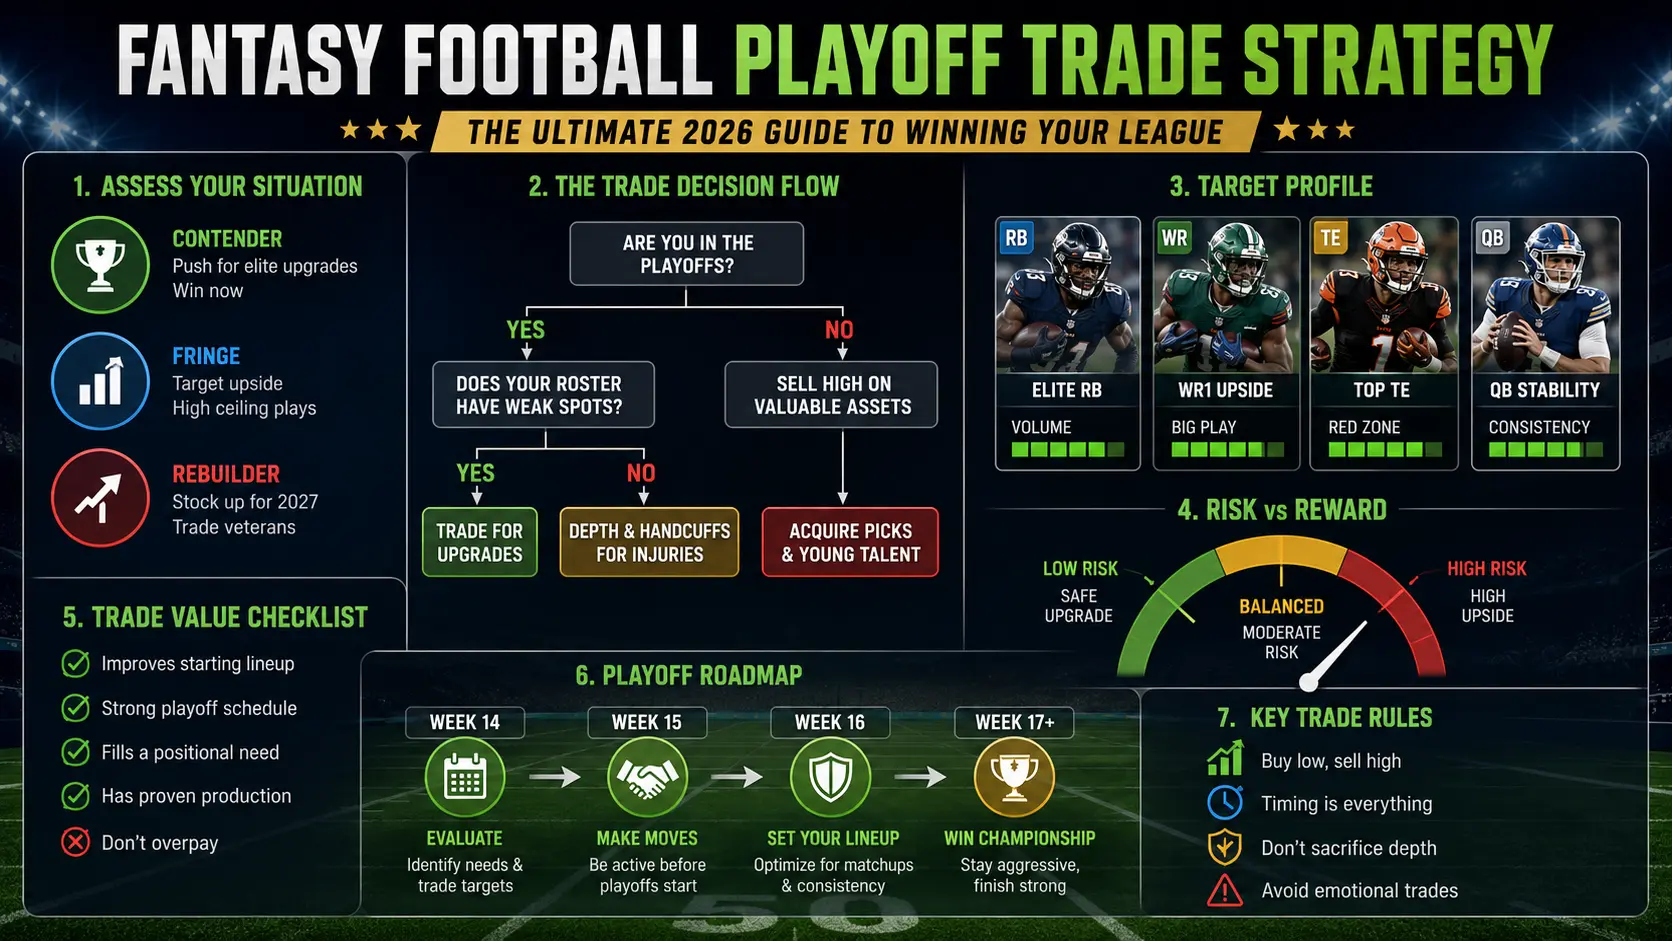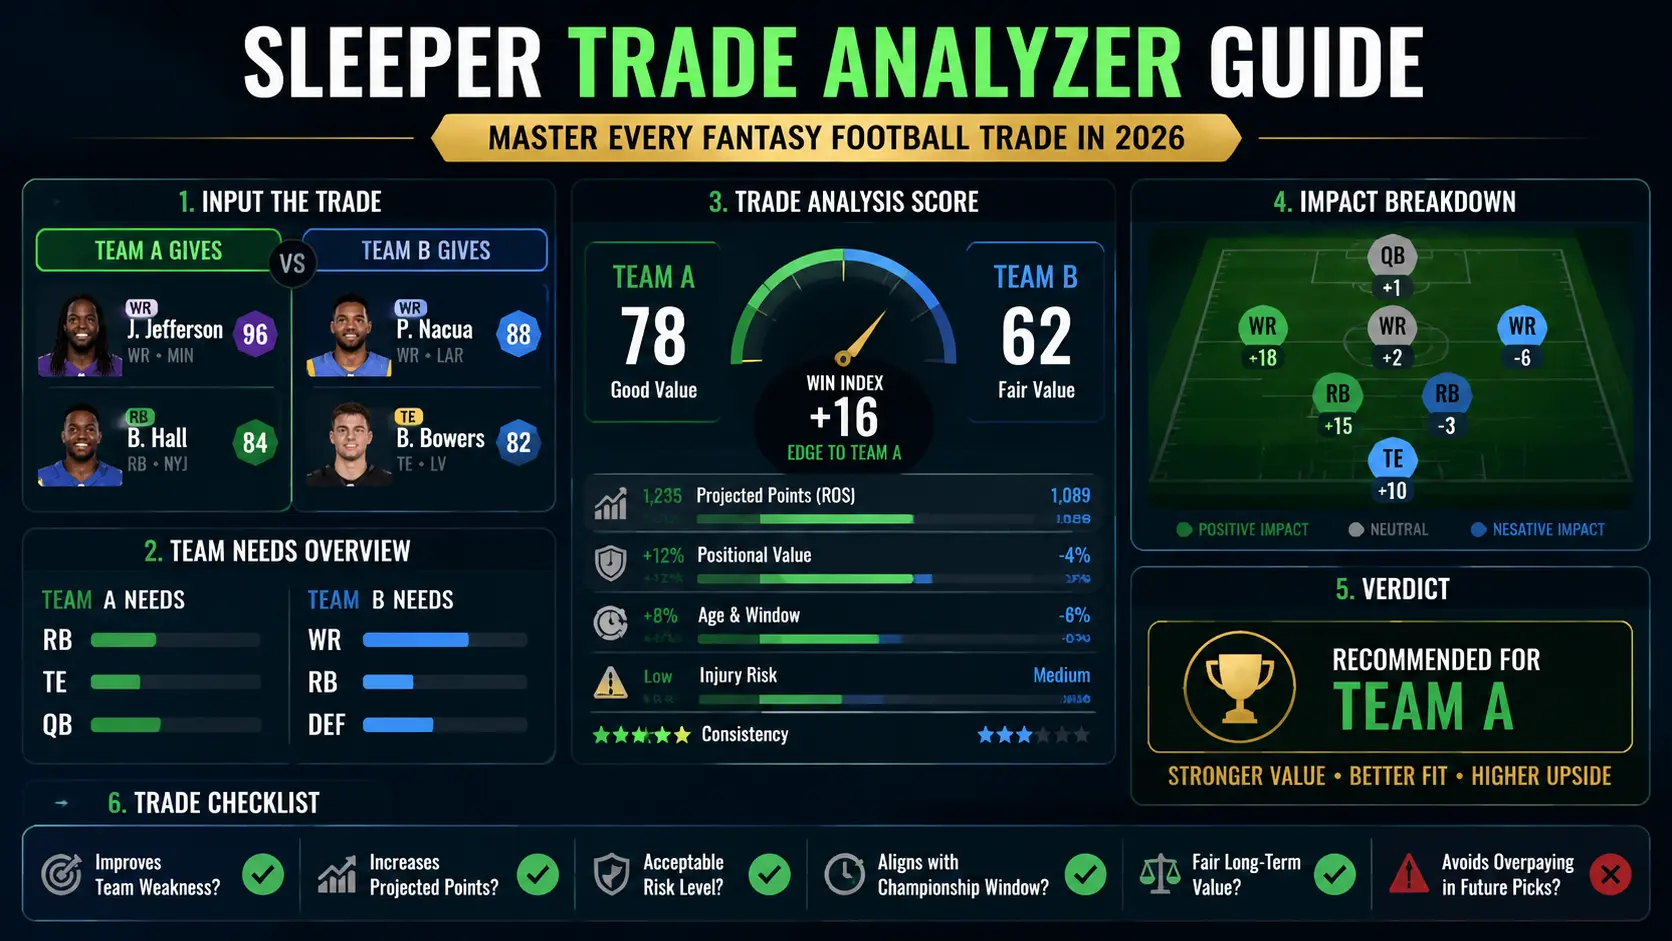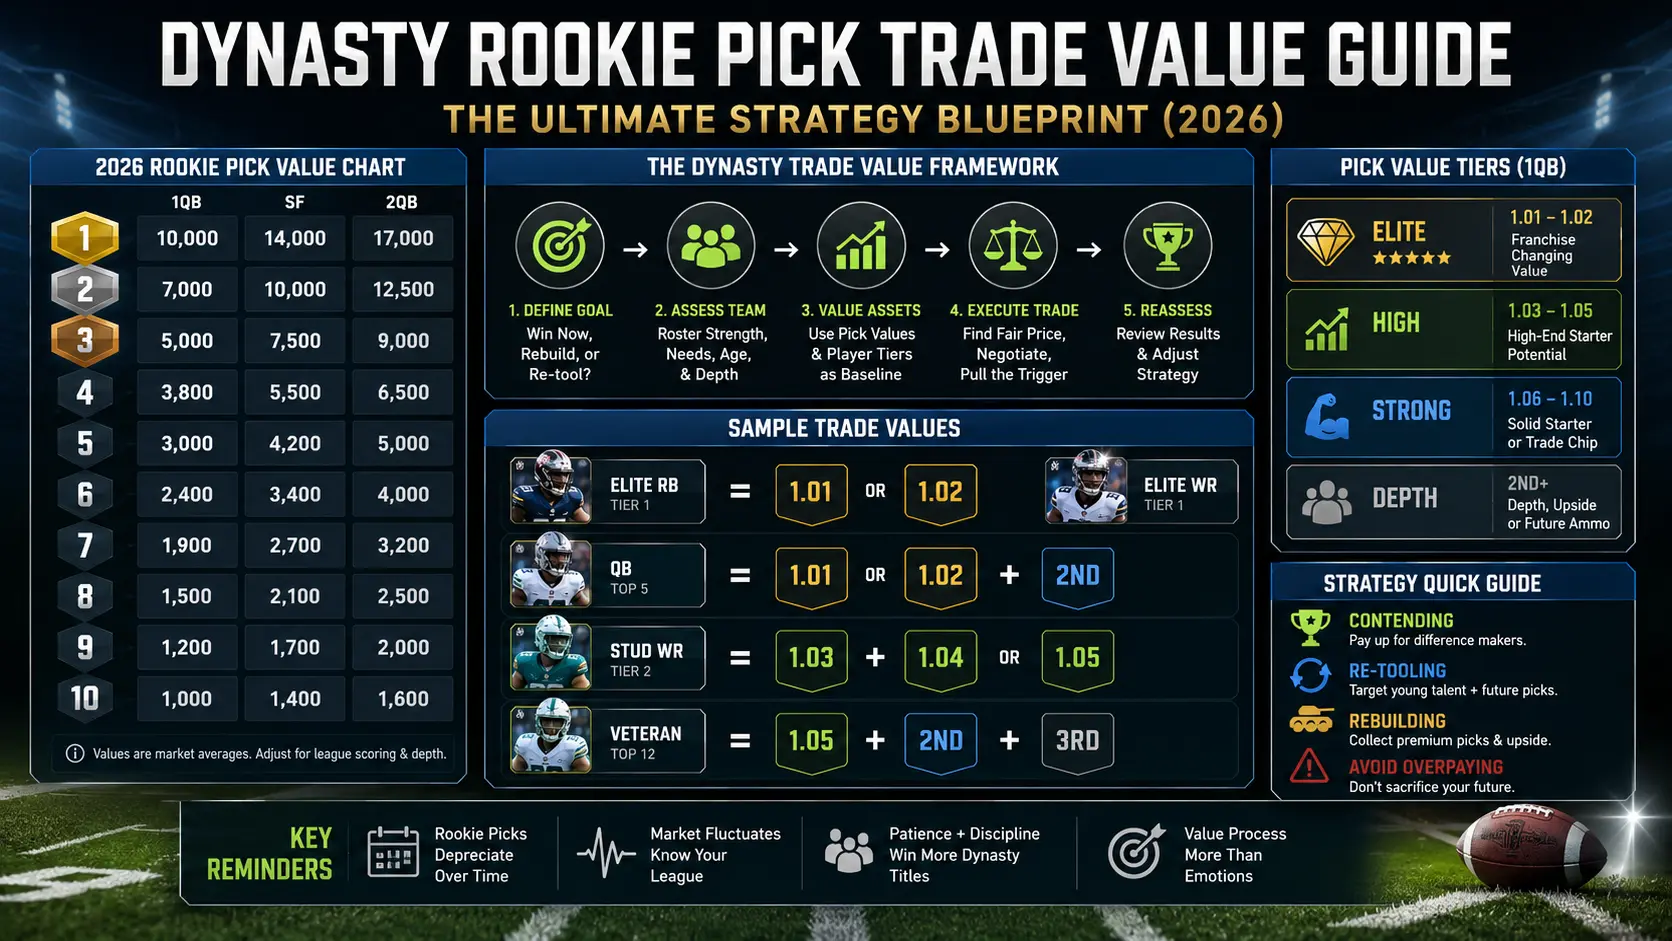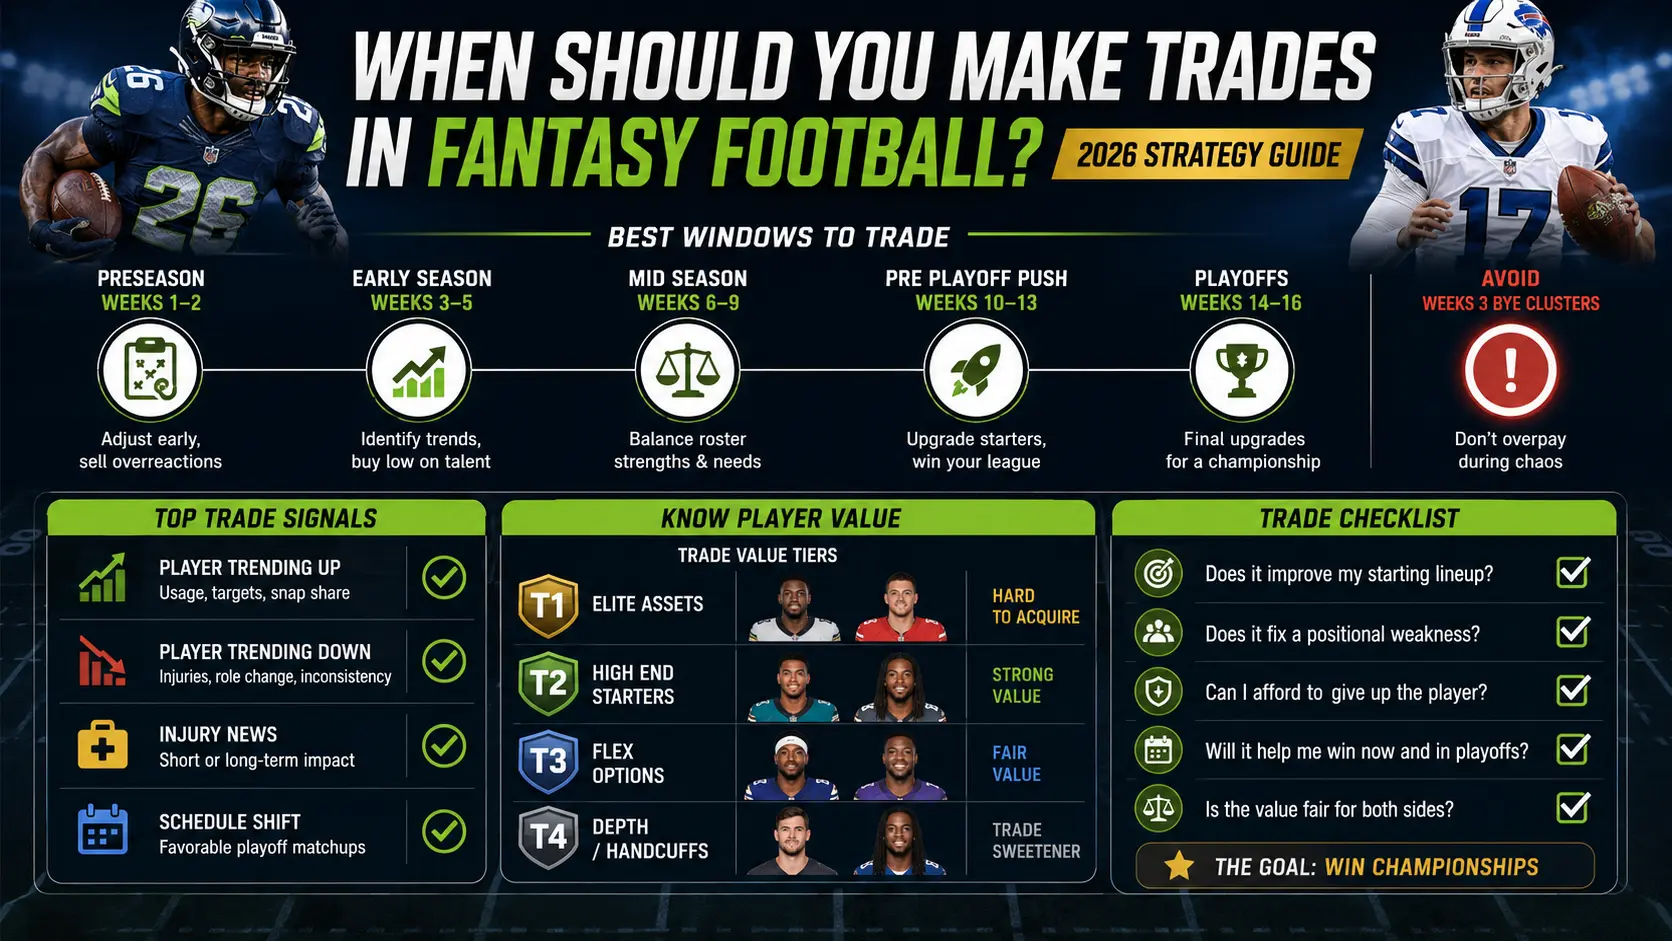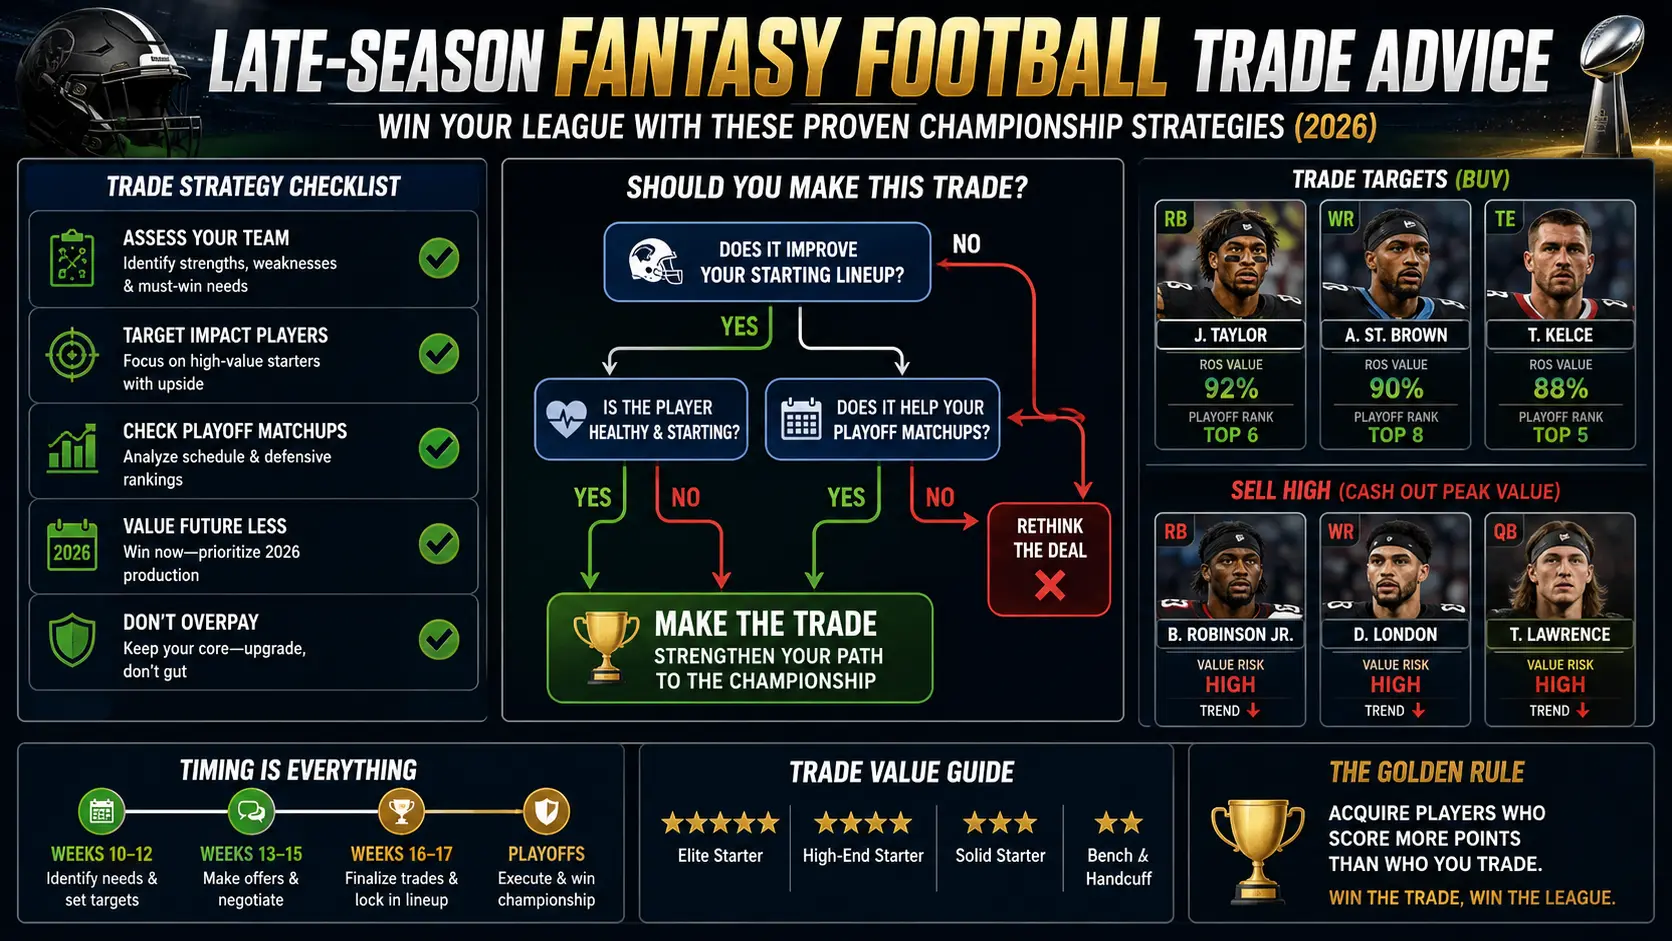
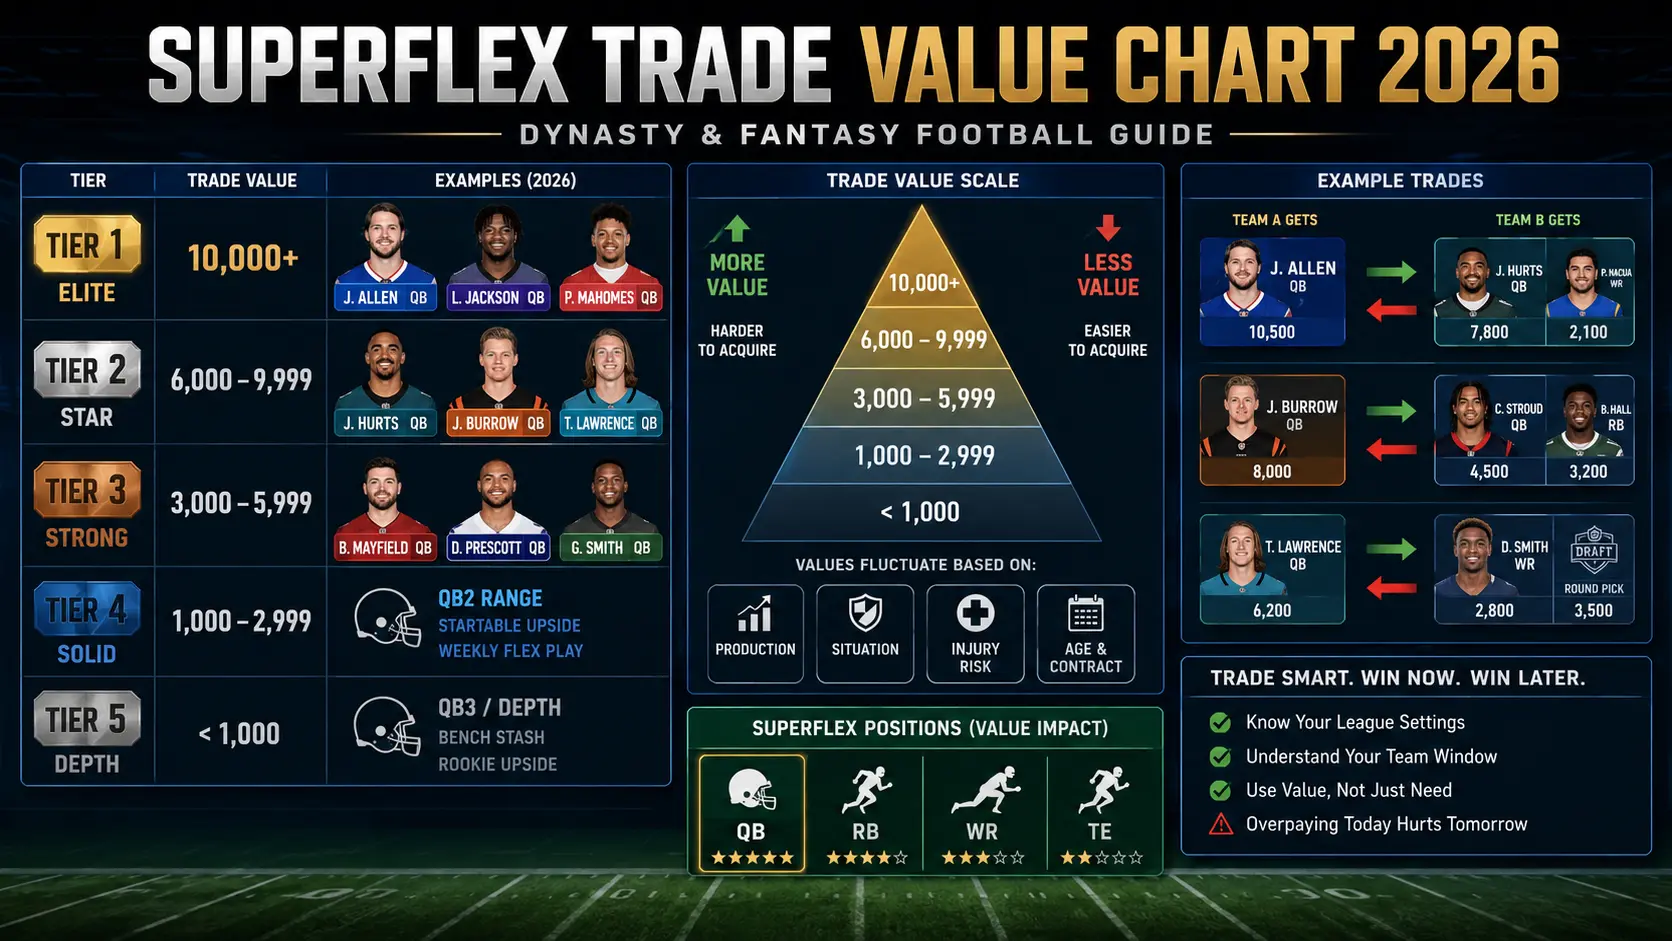
Whether you’re trying to acquire an elite quarterback, decide if multiple assets equal one superstar, or determine whether future rookie picks are worth moving, a Superflex Trade Value Chart is one of the most valuable tools in dynasty fantasy football.
Unlike traditional fantasy football leagues, Superflex formats dramatically increase quarterback value because managers can start two quarterbacks every week. That simple rule changes everything from draft strategy and roster construction to player tiers and trade negotiations.
However, many fantasy managers make one critical mistake: they treat every trade value chart as a fixed list of numbers. In reality, player values constantly shift based on league size, scoring settings, roster construction, injuries, contender status, rookie hype, and market sentiment.
This guide goes beyond simply listing values. You’ll learn how a Superflex Trade Value Chart works, how to adjust values for your specific league, and how experienced dynasty managers consistently win trades using advanced valuation techniques.
Table of Contents
- What Is a Superflex Trade Value Chart?
- Why Quarterbacks Dominate Superflex Formats
- How Trade Values Are Calculated
- Understanding Player Tiers Instead of Raw Numbers
- Sample 2026 Superflex Trade Value Chart
- Adjusting Values for Your League
- Dynasty vs Redraft Strategy
- Advanced Trading Techniques
- Common Trade Mistakes
- Recommended Resources
- Future Trends
- FAQs
TL;DR
- A Superflex Trade Value Chart assigns numerical values to players and draft picks to evaluate trade fairness.
- Quarterbacks carry significantly higher value than in one-QB leagues because they provide the safest weekly scoring floor.
- Dynasty values change throughout the year due to injuries, rookie drafts, free agency, and NFL training camps.
- Team context matters. Contenders and rebuilders should value the same player differently.
- Winning trades require understanding positional scarcity,n ot simply adding player values together.
What Is a Superflex Trade Value Chart?
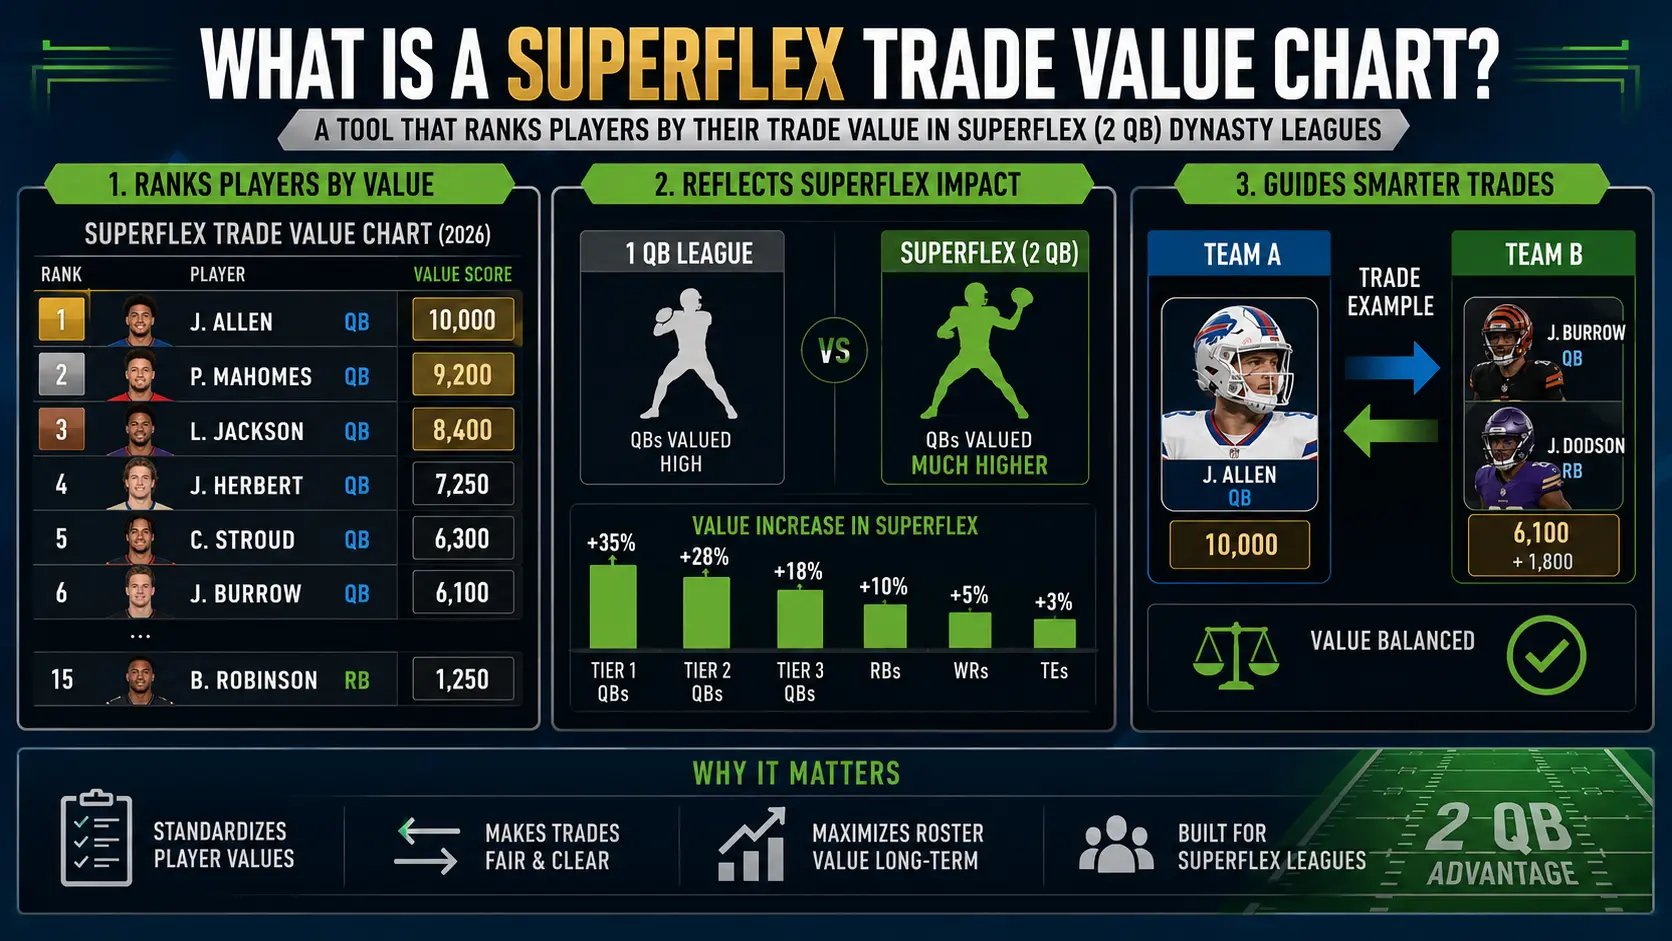
A Superflex Trade Value Chart is a numerical ranking system used to compare fantasy football assets during trade negotiations. Every player and draft pick receives a value based on production, age, positional scarcity, job security, and long-term upside.
Rather than asking, “Is this trade fair?”, managers can compare total values on both sides of a deal to determine whether the exchange is reasonably balanced.
For example:
| Asset | Example Trade Value |
| Elite Young QB | 100 |
| Elite WR | 82 |
| RB1 | 74 |
| Mid QB2 | 55 |
| Future 1st Round Pick | 48 |
| WR2 | 42 |
These numbers are guides, not guarantees. Successful fantasy managers adjust them based on league settings and team needs.
Why Every Dynasty Manager Needs One
A quality Superflex Trade Value Chart helps you:
- Evaluate offers objectively
- Avoid emotional decision-making
- Compare veterans and rookies
- Value future draft picks
- Build championship-caliber rosters
- Identify buy-low and sell-high opportunities
Think of it as a common currency that allows you to compare completely different assets.
Why Quarterbacks Dominate Superflex Leagues
The biggest difference between standard fantasy football and Superflex formats is quarterback scarcity.
In a one-quarterback league, only 10–12 quarterbacks start each week. Plenty of quality options remain on waivers.
In Superflex, most teams start two quarterbacks. Suddenly, nearly every NFL starter has value.
The Weekly Scoring Advantage
Even an average starting quarterback typically produces:
- 15–20 fantasy points
- High passing volume
- Reliable weekly floor
- Stable job security
Meanwhile, a WR3 or RB3 may score:
- 4 points
- 8 points
- 22 points
- 3 points
That inconsistency makes quarterbacks significantly more valuable.
Quick Decision Framework
When deciding between a quarterback and a skill player for your Superflex spot:
✅ Start the quarterback if:
- He’s projected to start.
- He’s healthy.
- He projects for 14+ fantasy points.
Consider the WR or RB only if:
- The quarterback may lose his job.
- He’s injured.
- The skill player has elite weekly upside.
This simple rule prevents one of the most common mistakes new Superflex managers make.
How Is Trade Value Calculated?
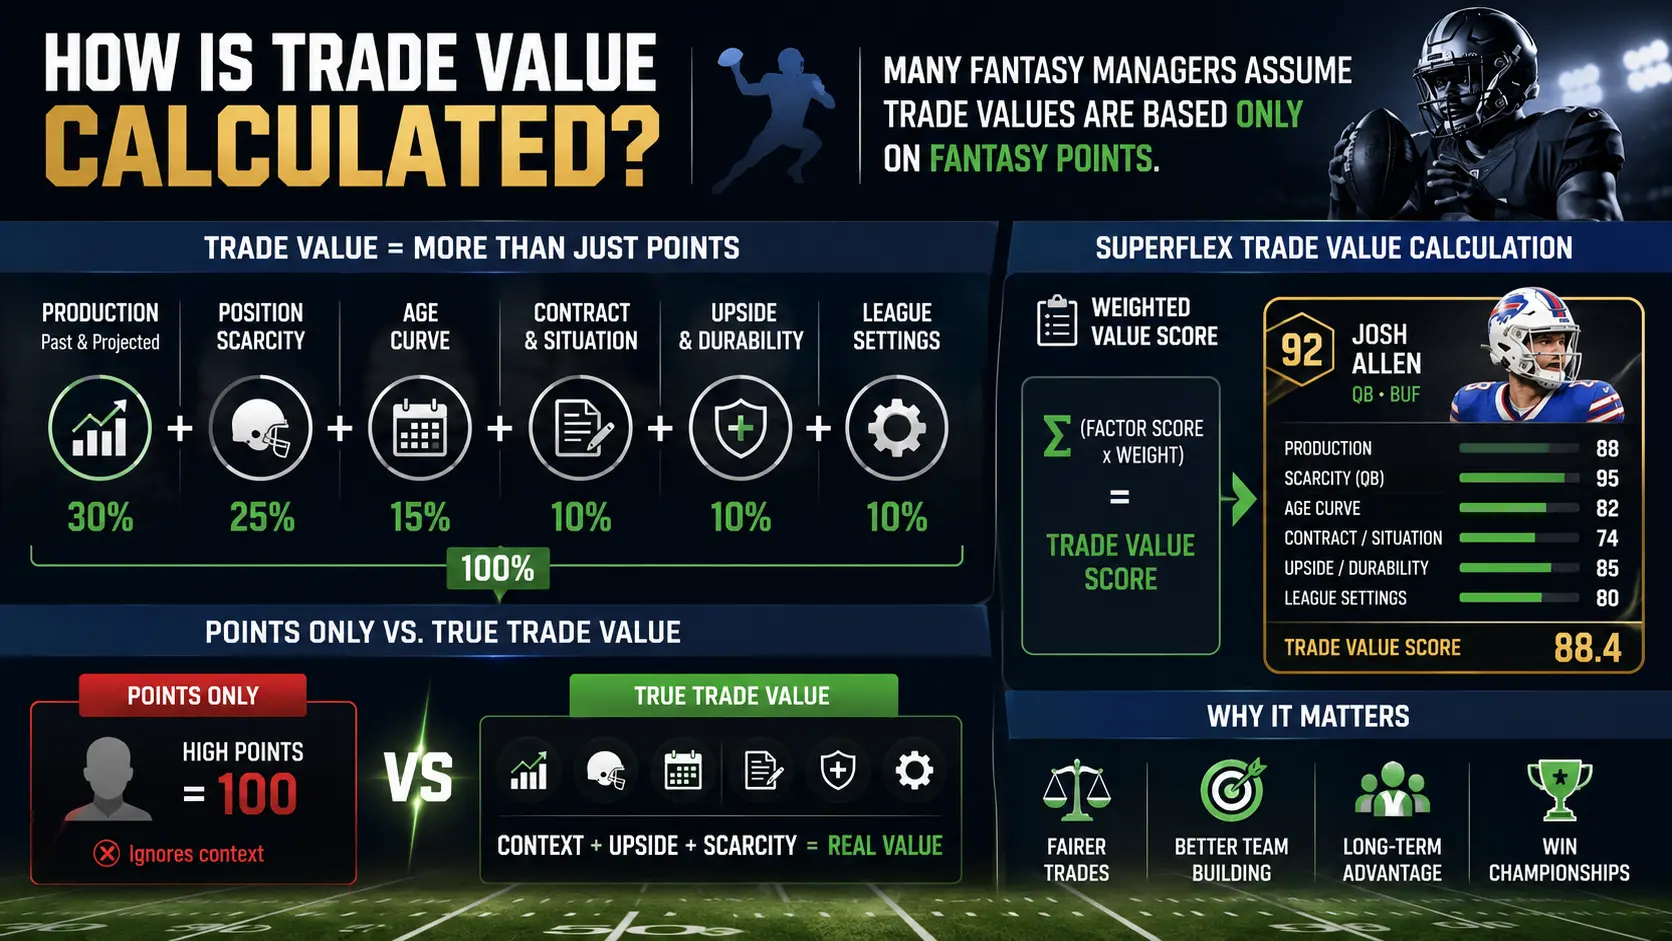
Many fantasy managers assume trade values are based only on fantasy points.
They’re not.
Modern dynasty valuation considers multiple variables.
Production
Current fantasy output remains important.
Elite producers naturally receive higher scores.
Age
Age affects dynasty leagues much more than redraft.
Example:
| Player Type | Dynasty Impact |
| 23-year-old QB | Premium asset |
| 24-year-old WR | Extremely valuable |
| 30-year-old RB | Significant depreciation |
| 34-year-old QB | Productive but declining value |
Positional Scarcity
Quarterbacks receive a premium because there are fewer reliable starters.
Wide receivers generally retain value longer than running backs.
Elite tight ends receive an additional boost in TE Premium leagues.
Job Security
A young franchise quarterback signed to a long-term contract has much greater dynasty value than an aging bridge quarterback who may lose his starting role next season.
This concept, often called asset insulation,n helps explain why some players maintain high trade value even after a disappointing season.
Understanding Player Tiers Instead of Raw Numbers
One mistake many managers make is focusing on small numerical differences.
For example:
- Player A: 66
- Player B: 64
Those players belong in the same tier.
Trading down within a tier is often worthwhile if you gain an extra draft pick.
The real danger comes when you cross a tier break.
Example Tier Structure
Tier 1
- Elite franchise quarterbacks
- Elite young wide receivers
Tier 2
- Proven QB1s
- Young WR1s
- Elite tight ends (TE Premium)
Tier 3
- Veteran starters
- High-upside rookies
- Mid first-round rookie picks
Whenever possible, trade within tiers, not across them.
Sample 2026 Superflex Trade Value Chart
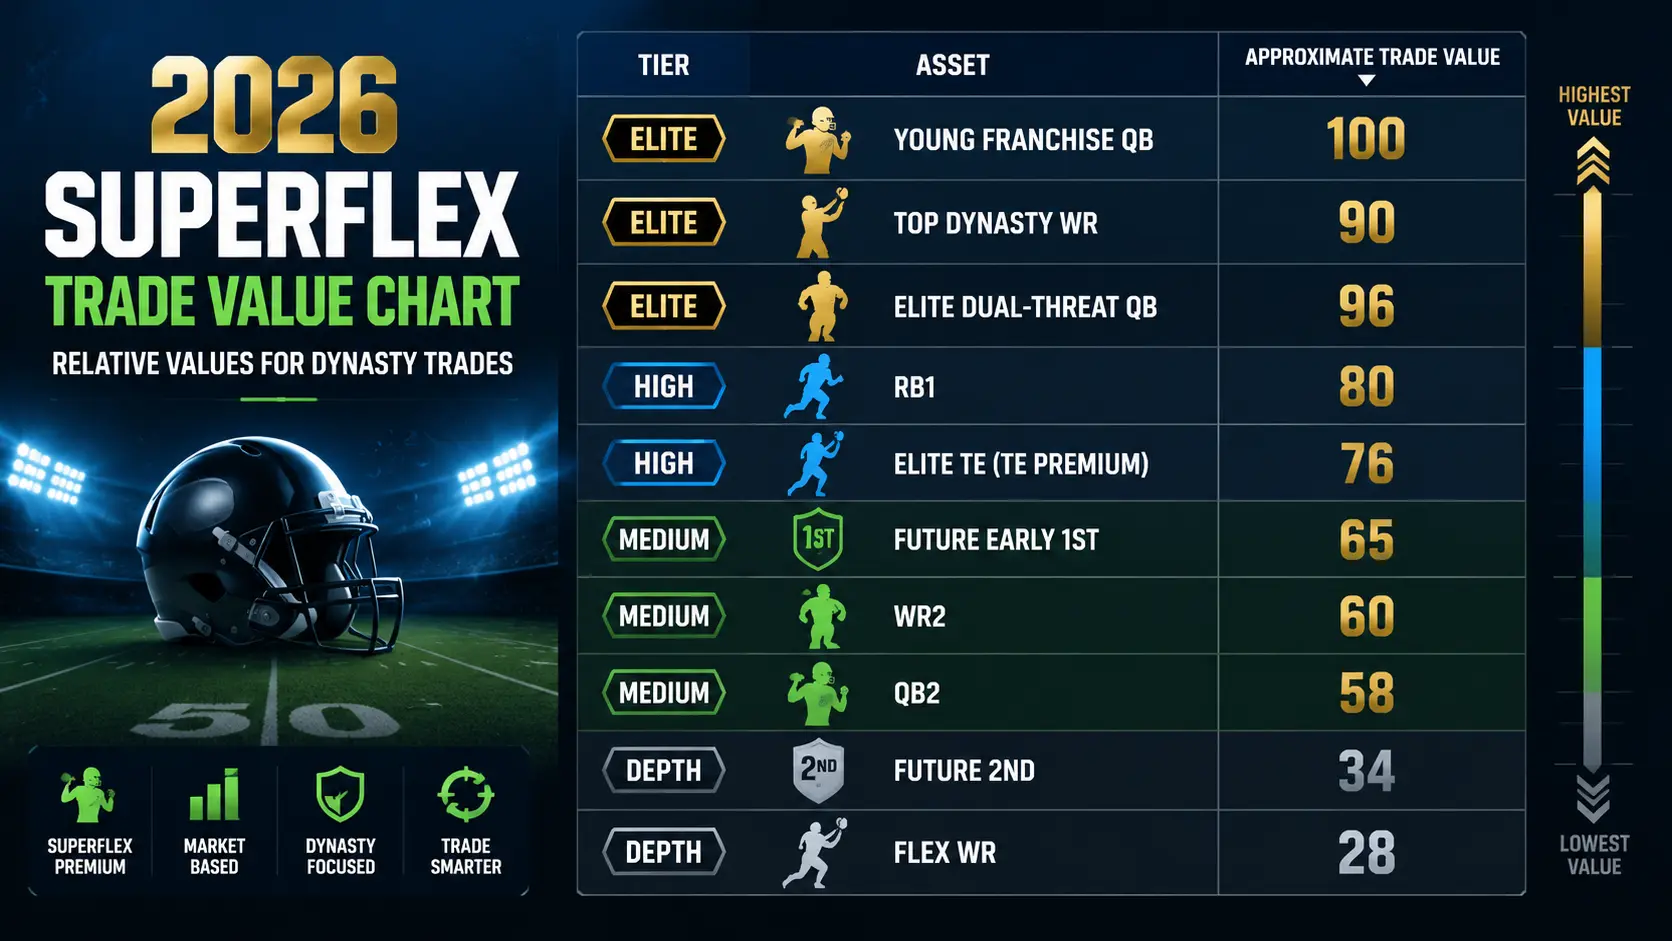
The following example illustrates relative player values rather than exact rankings.
| Tier | Asset | Approximate Trade Value |
| Elite | Young Franchise QB | 100 |
| Elite | Top Dynasty WR | 90 |
| Elite | Elite Dual-Threat QB | 96 |
| High | RB1 | 80 |
| High | Elite TE (TE Premium) | 76 |
| Medium | Future Early 1st | 65 |
| Medium | WR2 | 60 |
| Medium | QB2 | 58 |
| Depth | Future 2nd | 34 |
| Depth | Flex WR | 28 |
Remember that these values should be adjusted based on:
- League size
- PPR vs Half-PPR
- Tight End Premium
- Team direction
- Injuries
- Market trends
- Rookie draft season
Key Takeaway
A Superflex Trade Value Chart is far more than a list of player rankings. The most successful dynasty managers understand that trade values are dynamic, influenced by league settings, roster construction, and market timing. Instead of treating the chart as an absolute rulebook, use it as a framework for making smarter, context-driven decisions.
Adjusting Superflex Trade Values for Your League
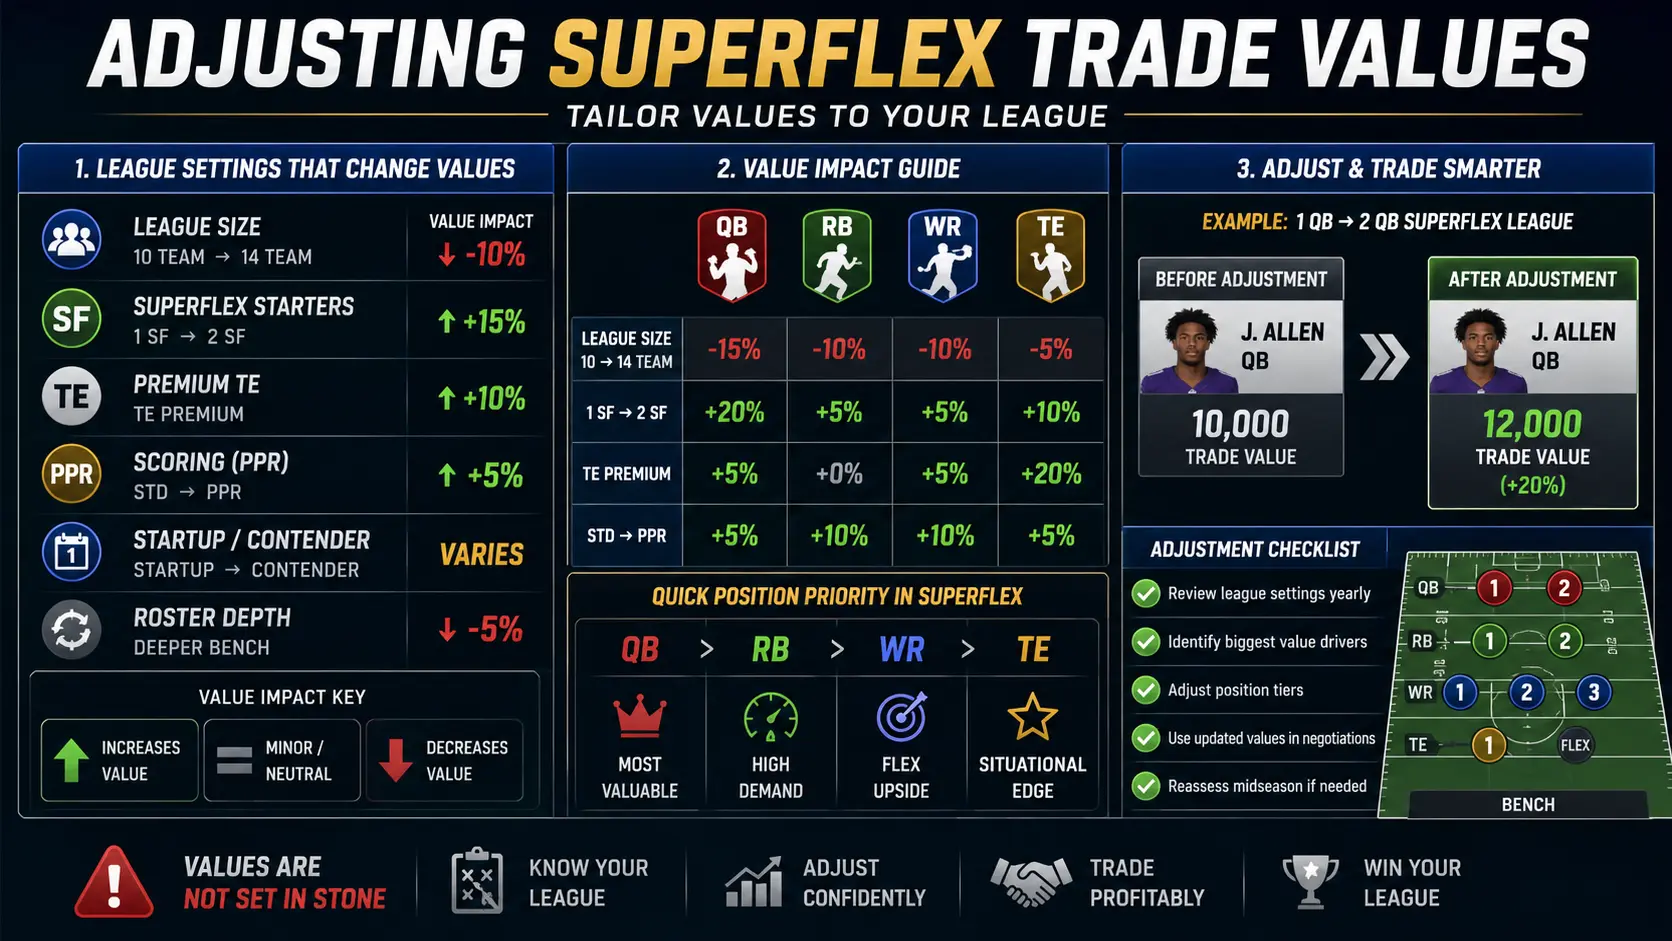
One of the biggest mistakes fantasy managers make is using a generic Superflex Trade Value Chart without considering their league’s unique settings. While most published charts assume a standard 12-team PPR dynasty league, your league may operate very differently.
Factors like league size, scoring system, roster requirements, bench depth, and tight end premium scoring can significantly impact player values. Making these adjustments allows you to use any Superflex Trade Value Chart more effectively.
League Size Matters More Than Most Managers Realize
Quarterback scarcity changes dramatically depending on the number of teams.
In a 10-team league, there are usually enough starting quarterbacks for every manager to field two quality options. However, in a 14-team league, even low-end NFL starters become valuable because there simply aren’t enough reliable quarterbacks available.
Positional Value by League Size
| Position | 10 Teams | 12 Teams | 14 Teams |
| Elite QB | Very High | Elite | Untouchable |
| Mid QB2 | Moderate | High | Extremely High |
| WR1 | Elite | Elite | High |
| RB1 | High | High | Moderate |
| Future First | High | High | High |
Strategy Tip:
As league size increases, quarterback value rises faster than any other position. Managers in 14-team Superflex leagues should rarely trade away starting quarterbacks without receiving a premium return.
Dynasty vs. Redraft Trade Values
Many fantasy managers accidentally use a Superflex Trade Value Chart designed for redraft leagues when negotiating dynasty trades. This is a costly mistake because dynasty leagues value long-term potential alongside immediate production.
Dynasty Managers Prioritize:
- Youth
- Contract stability
- Long-term upside
- Rookie draft picks
- Franchise quarterbacks
Redraft Managers Prioritize:
- Weekly production
- Favorable schedules
- Injury recovery timelines
- Championship-winning veterans
Example
Imagine two quarterbacks:
Quarterback A
- 24 years old
- Expected starter for the next decade
- Slightly lower fantasy production this season
Quarterback B
- 36 years old
- Top-five scorer this year
- Uncertain future beyond one season
In dynasty formats, Quarterback A is usually the more valuable asset despite producing fewer fantasy points today.
The Biggest Mistake: The 2-for-1 Trade Problem
One area where many online trade charts fall short is evaluating package deals.
Suppose you’re offered:
- WR2
- RB2
- Future 2nd
for
- Elite QB
At first glance, the combined trade values may appear equal. However, experienced dynasty managers know they are not.
Why?
Roster spots have value.
When you receive three players for one, you eventually need to cut two players from your bench.
Those dropped players have value, even if they aren’t stars.
This hidden cost is known as the Roster Spot Tax.
Simple Formula
Instead of calculating:
Player A = 100
Player B = 40
Player C = 35
Player D = 25
Total = 100
Adjust for roster cost:
40 + 35 + 25 = 100
Minus 15–20% consolidation penalty
Adjusted Value ≈ 80–85
That package is no longer equal.
Elite players are usually worth more than several average assets.
Contender vs. Rebuilder Adjustments
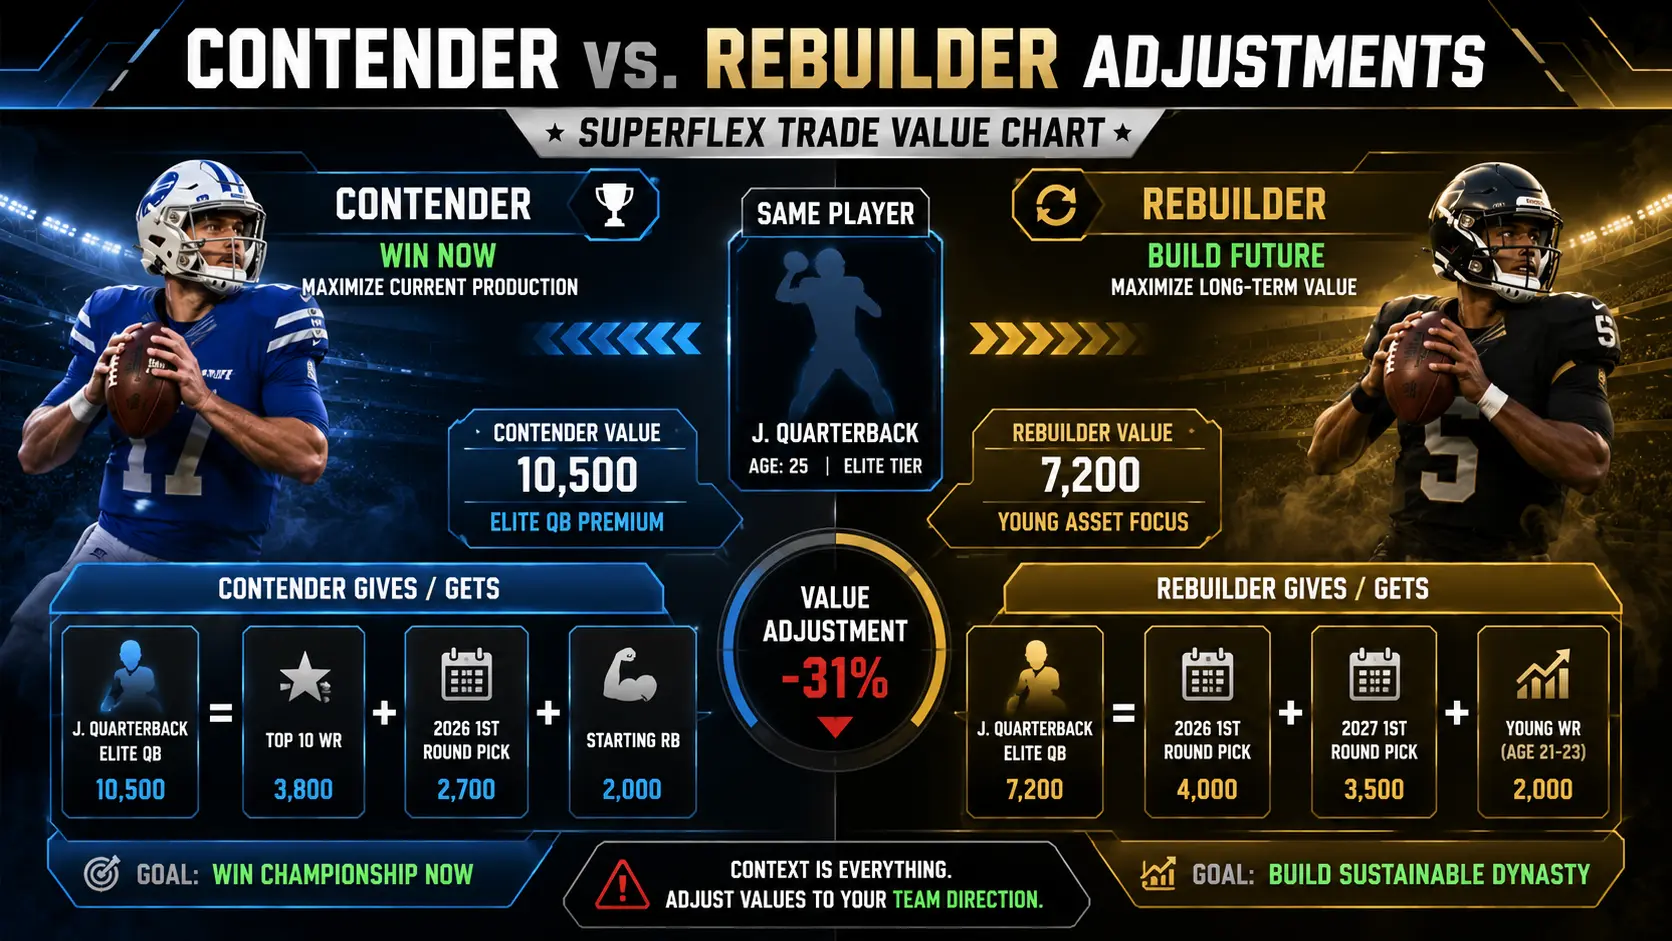
A Superflex Trade Value Chart should never be interpreted without considering your team’s direction.
The same player can have completely different value depending on whether you’re competing for a championship or rebuilding for future seasons.
If You’re a Contender
Prioritize:
- Proven veterans
- Reliable weekly starters
- Immediate production
- Championship-winning depth
Be willing to trade:
- Future draft picks
- Developmental prospects
- Injured players with long recovery timelines
If You’re Rebuilding
Focus on:
- Young quarterbacks
- Rookie picks
- Second-year breakout candidates
- Long-term upside
Avoid paying premium prices for aging running backs nearing the end of their peak production.
Example
A 31-year-old RB may be invaluable to a championship contender but offer very little to a rebuilding roster.
Context always matters more than the raw numbers on a trade chart.
Draft Pick Values Change Throughout the Year
One of the least understood aspects of dynasty trading is how rookie draft pick values fluctuate during the calendar year.
They are not static assets.
Typical Annual Value Cycle
| Time of Year | Pick Value |
| Midseason | Lowest |
| Fantasy Playoffs | Rising |
| NFL Combine | Higher |
| NFL Draft Week | Peak Value |
| Rookie Training Camp | Slight Decline |
Managers often regret selling first-round picks during the season because those same selections become significantly more valuable just before rookie drafts.
Whenever possible, wait until draft season if you plan to move future picks.
Adjusting for TE Premium and PPR Scoring
League scoring settings can significantly alter trade values.
Tight End Premium (TEP)
If your league awards 1.5 or 2.0 points per reception for tight ends:
- Elite tight ends become cornerstone assets.
- Young elite TEs often rise into the same value tier as WR1s.
- Mid-tier tight ends also become viable trade targets.
Half-PPR vs. Full PPR
In Half-PPR leagues:
- Workhorse running backs gain value.
- Possession receivers lose some appeal.
- Touchdown-dependent players become more valuable.
Never rely on a generic Superflex Trade Value Chart without confirming it matches your league’s scoring format.
Also Read
How to Evaluate Fantasy Football Trades Like an Expert in 2026 and Win More Leagues
This guide pairs perfectly with trade value charts by helping you identify players whose market value is likely to rise or fall before your league mates notice.
Key Takeaways
- Customize every Superflex Trade Value Chart based on your league settings.
- League size has the biggest impact on quarterback values.
- Dynasty and redraft charts should never be used interchangeably.
- Package trades require a roster spot adjustment rather than a simple addition.
- Team direction, contender or rebuild,r should always influence your trade decisions.
- Draft pick values change throughout the year, so timing matters as much as the asset itself.
Advanced Superflex Trading Strategies That Win More Deals
The best dynasty managers don’t rely on a Superflex Trade Value Chart alone; they combine it with timing, market psychology, roster analysis, and league context. Understanding these advanced concepts can help you consistently gain value over multiple seasons.
Buy Low and Sell High at the Right Time
Player values fluctuate throughout the NFL calendar. Rather than reacting to last week’s fantasy points, successful managers anticipate where the market is heading.
Buy-Low Opportunities
Target players who have temporarily lost value due to:
- Minor injuries
- Slow starts
- Coaching changes
- Negative media narratives
- Rookie hype is overshadowing veterans
Sell-High Opportunities
Consider moving players when:
- They’re coming off career-best performances
- Touchdown production is unsustainably high
- Their role may decrease
- They are approaching the age cliff in their position
Timing often matters just as much as player talent.
Understand Asset Insulation
Not every player loses value at the same rate.
Young franchise quarterbacks are considered insulated assets because their long-term job security protects their dynasty value, even during a disappointing season.
Highly Insulated Assets
- Young franchise quarterbacks
- Elite wide receivers under 27
- Top rookie draft picks
- Elite tight ends in TE Premium leagues
Rapidly Depreciating Assets
- Aging running backs
- Backup quarterbacks
- Veteran WR3s
- One-year rental players
Whenever possible, build your roster around insulated assets and use short-term producers to chase championships.
Recognize Tier Breaks Before Trading
Trade charts assign numbers, but championships are often won by understanding tiers.
For example:
Tier 1
- Elite franchise quarterbacks
Tier 2
- Young QB1s
- Elite wide receivers
Tier 3
- Veteran quarterbacks
- WR2s
- RB1s
Trading from the bottom of one tier into the top of the next is usually worth paying a premium. Trading down within the same tier is often an excellent way to accumulate additional draft capital.
Negotiation Psychology Matters
Fantasy football trades involve people, not spreadsheets.
Even if a trade is mathematically fair, it may still be rejected because of human psychology.
Common Psychological Biases
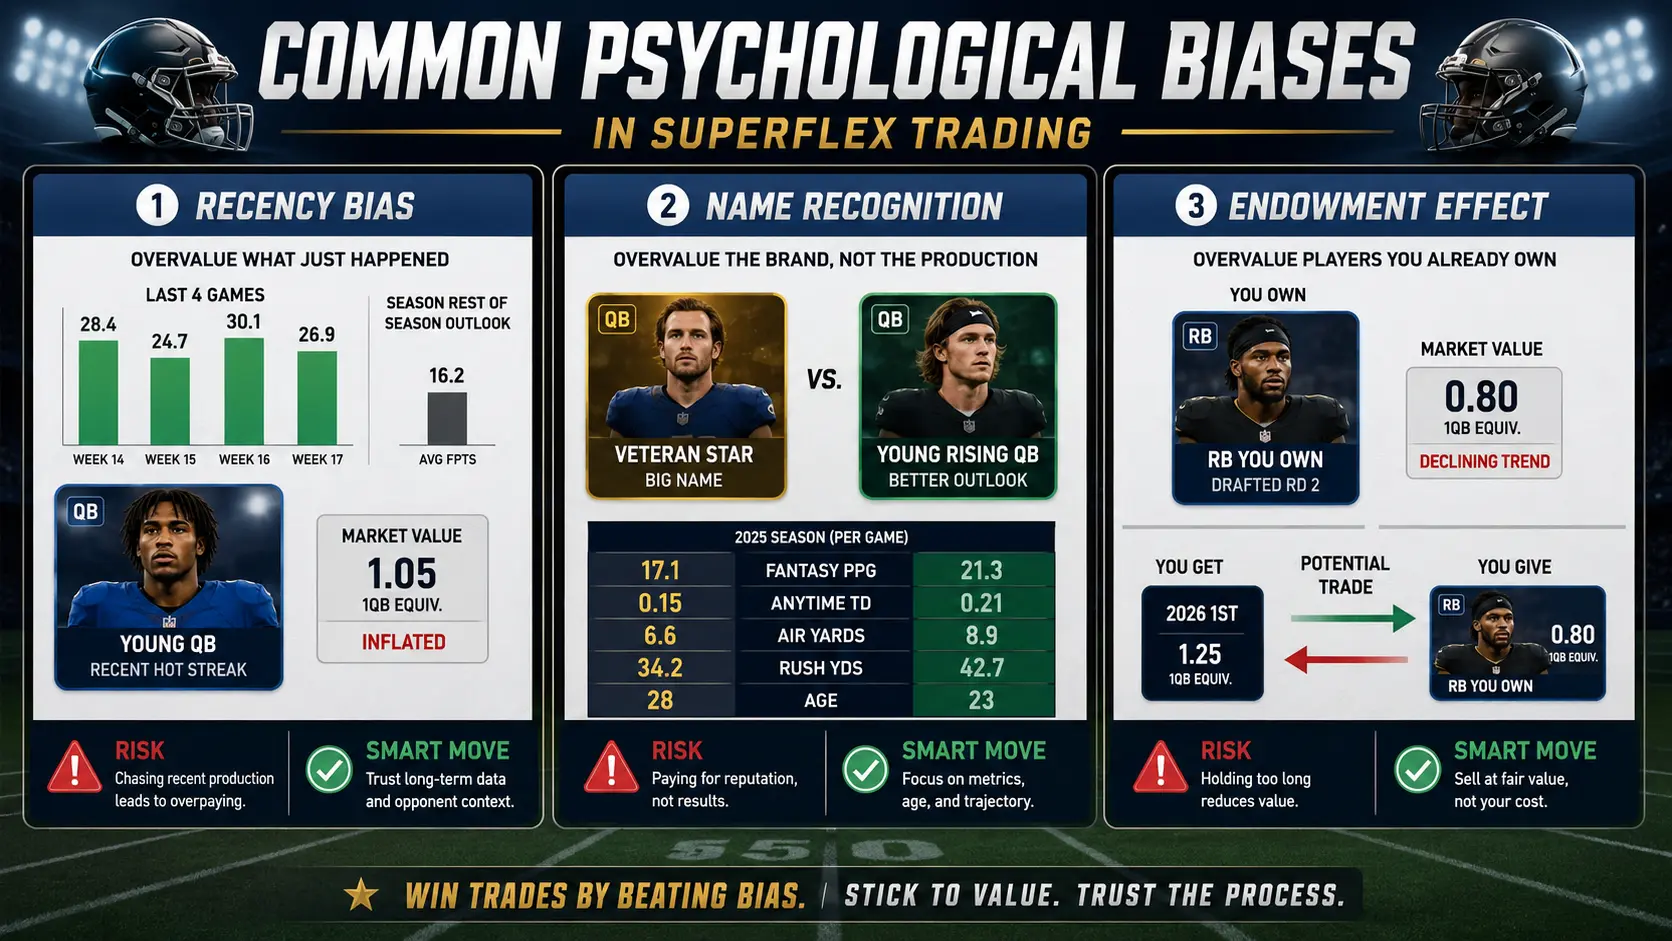
Endowment Effect
Managers naturally overvalue players already on their roster.
Recency Bias
Recent performances influence decisions more than long-term production.
Name Recognition
Established veterans are frequently overvalued compared to younger breakout candidates.
Tips for Better Trade Negotiations
- Explain why the trade benefits both teams.
- Avoid sending obviously one-sided offers.
- Target managers based on their roster needs.
- Be patient rather than rushing negotiations.
- Use your Superflex Trade Value Chart as a conversation starter, not as proof that your offer is “correct.”
Building trust with league mates often leads to more successful trades over time.
Common Mistakes to Avoid
Even experienced dynasty managers can misuse a Superflex Trade Value Chart. Avoid these common errors to make smarter decisions.
Treating Trade Values as Absolute
Charts are guidelines, not rigid rules. League context and roster construction should always influence your decisions.
Ignoring Quarterback Scarcity
In Superflex formats, reliable starting quarterbacks are among the most valuable assets in fantasy football. Trading one away without receiving premium value is rarely a good move.
Forgetting the Roster Spot Tax
A package of four average players rarely equals one elite player once roster limitations are considered.
Overreacting to One Week
A single breakout game or one disappointing performance shouldn’t dramatically change your long-term player evaluations.
Ignoring Future Pick Timing
Future first-round picks generally increase in value as the rookie draft season approaches. Selling them too early often leaves value on the table.
Recommended Tools and Resources
A Superflex Trade Value Chart becomes even more useful when combined with trusted fantasy football resources.
Fantasy Platforms
- Sleeper
- ESPN Fantasy Football
- Yahoo Fantasy Sports
- MyFantasyLeague (MFL)
Research Resources
- NFL depth charts
- Injury reports
- Snap count and usage data
- Rookie scouting reports
- Strength of schedule tools
Using multiple sources helps you make informed decisions rather than relying on one ranking system.
Future Trends in Superflex Dynasty Leagues
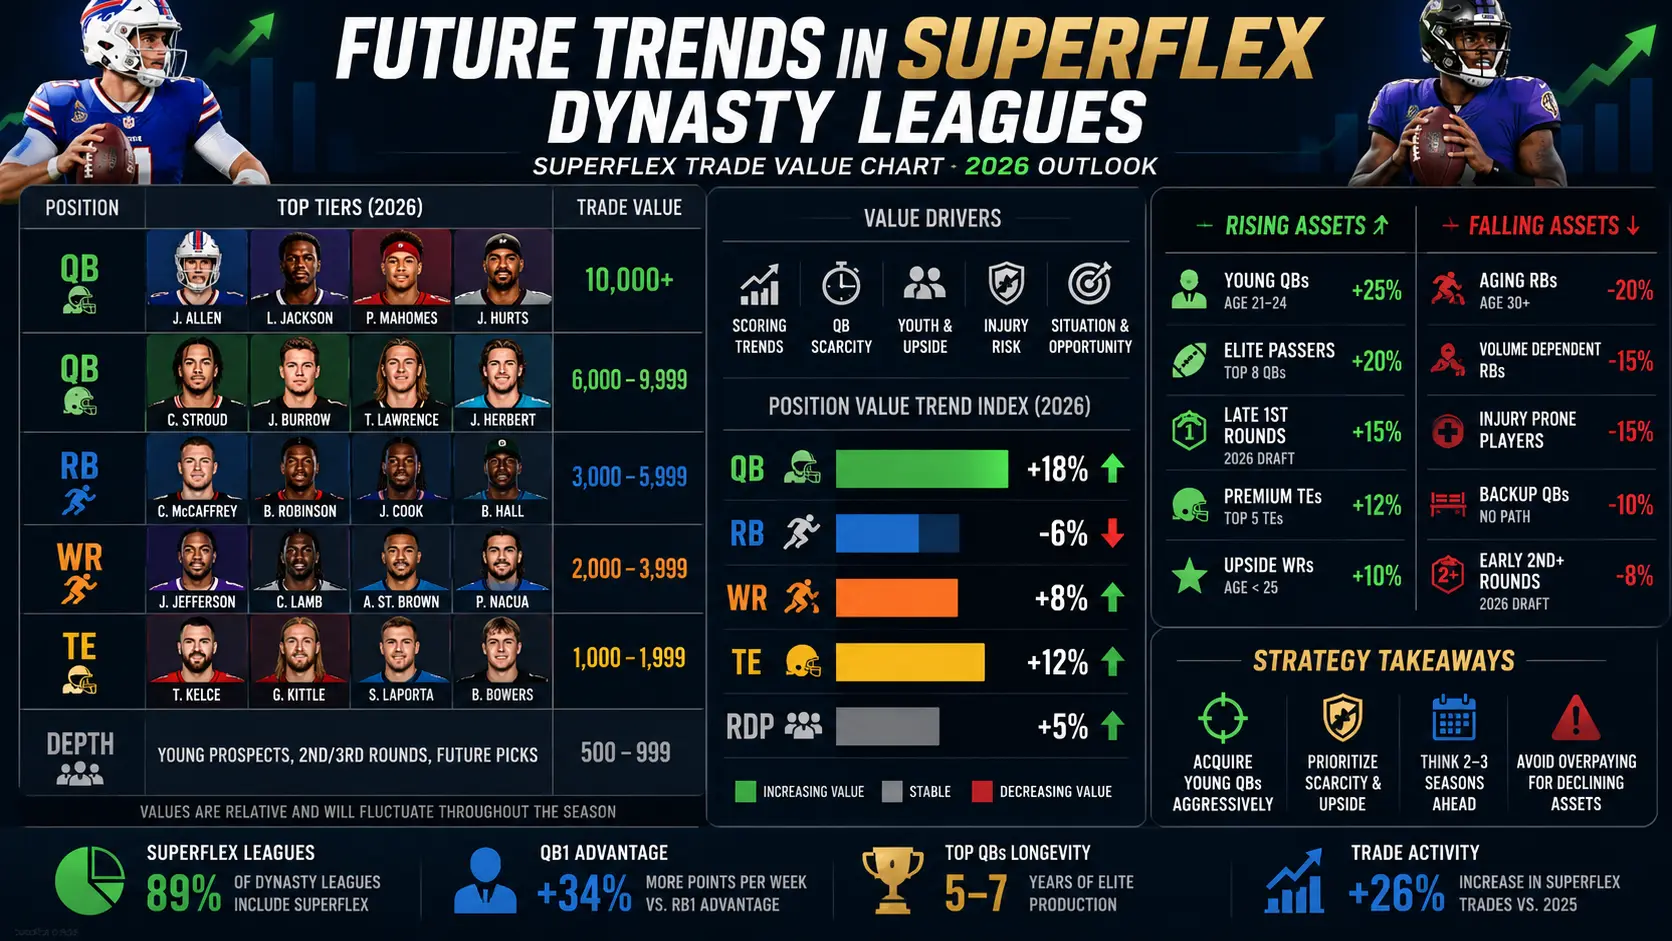
Dynasty fantasy football continues to evolve, and trade values are changing with it.
Trends to Watch in 2026
- Mobile quarterbacks remain premium dynasty assets due to their dual-threat upside.
- Rookie quarterback classes continue to drive massive swings in draft pick values.
- League managers increasingly favor young wide receivers over aging running backs.
- Analytics-based valuation models are becoming more common than simple ranking lists.
- AI-powered projections and customizable trade calculators are improving trade analysis.
Managers who adapt to these trends will have a long-term advantage over competitors relying on outdated valuation methods.
Conclusion
A Superflex Trade Value Chart is one of the most valuable tools available to dynasty fantasy football managers, but it should never be used in isolation. The best trades account for league size, scoring format, roster construction, team direction, market timing, and positional scarcity.
Rather than chasing perfect numerical equality, focus on building long-term roster value. Understand tier breaks, recognize insulated assets, adjust for contender versus rebuilder strategies, and always account for the hidden cost of multi-player trades.
As the 2026 fantasy football season approaches, staying informed and flexible will help you identify buying opportunities before the rest of your league catches on. Use your trade value chart as a framework, not a rulebook,k and you’ll consistently make smarter, more profitable decisions.
Also Read: Buy Low Sell High Fantasy Football Players Guide to Winning More Trades in 2026
Frequently Asked Questions
1. What is a Superflex Trade Value Chart?
A Superflex Trade Value Chart is a tool that assigns numerical values to fantasy football players and draft picks, helping managers evaluate whether a trade is fair based on positional scarcity, production, age, and long-term value.
2. Why are quarterbacks worth so much in Superflex leagues?
Because managers can start two quarterbacks each week, reliable NFL starters become scarce. Their consistent weekly scoring makes them significantly more valuable than in traditional one-quarterback leagues.
3. How often should a Superflex Trade Value Chart be updated?
Ideally, trade values should be reviewed weekly during the NFL season and after major events such as free agency, the NFL Draft, training camp, preseason injuries, and significant player transactions.
4. Should I use the same trade chart for dynasty and redraft leagues?
No. Dynasty leagues emphasize youth, long-term upside, and future draft picks, while redraft leagues focus almost entirely on current-season production.
5. How do future rookie picks fit into a Superflex Trade Value Chart?
Future picks are valuable dynasty assets whose market price changes throughout the year. They typically reach peak value just before the rookie draft, making timing an important part of any trade strategy.
6. How do TE Premium leagues affect trade values?
In TE Premium formats, elite tight ends receive additional value because receptions score more points. This often moves top-tier tight ends into the same trade range as elite wide receivers.
7. Why don’t package trades always equal superstar value?
Multi-player trades require managers to use additional roster spots. This “roster spot tax” reduces the practical value of multiple average players compared to one elite asset.
8. Can I rely entirely on a Superflex Trade Value Chart when making trades?
No. A Superflex Trade Value Chart is a valuable starting point, but successful trades also consider league settings, team goals, injuries, market trends, and the needs of the manager on the other side of the negotiation.